Analysis of time series data from swimming fish, orientation of the principal components in a high-dimensional data
Jun 2024 – Jul 2024 · Dept. of Mathematics, Grove City College
- Explored fish swimming motion with peer and faculty and presented poster at JMM 2025
- Implemented and applied sliding window embedding on data to capture motion
- Transformed data with PCA (scikit-learn) and persistence diagrams (ripser)
- Visualized results using matplotlib and documented the codebase following numpy conventions
In the summer after my freshman year, I did research under Dr. Michael Jackson with a fellow peer through the Student Opportunities in Accelerated Research (SOAR) program at the Grove City College’s Department of Mathematics.
We studied the swimming motion of fish using topological data analysis (TDA) methods using fish swimming data collected by Dr. Eric Anderson (Mechanical Engineering, Grove City College). The data was given to us as CSV files containing time series data of the position of points along the fish’s body as it swam in a flow tank at different water speeds.
We worked on top of an existing codebase that implemented the necessary preprocessing:
- Removing incomplete frames from the data,
- Tail extraction and data normalization to account for differences in position in the tank,1 and
- Sliding window embedding to capture motion.2
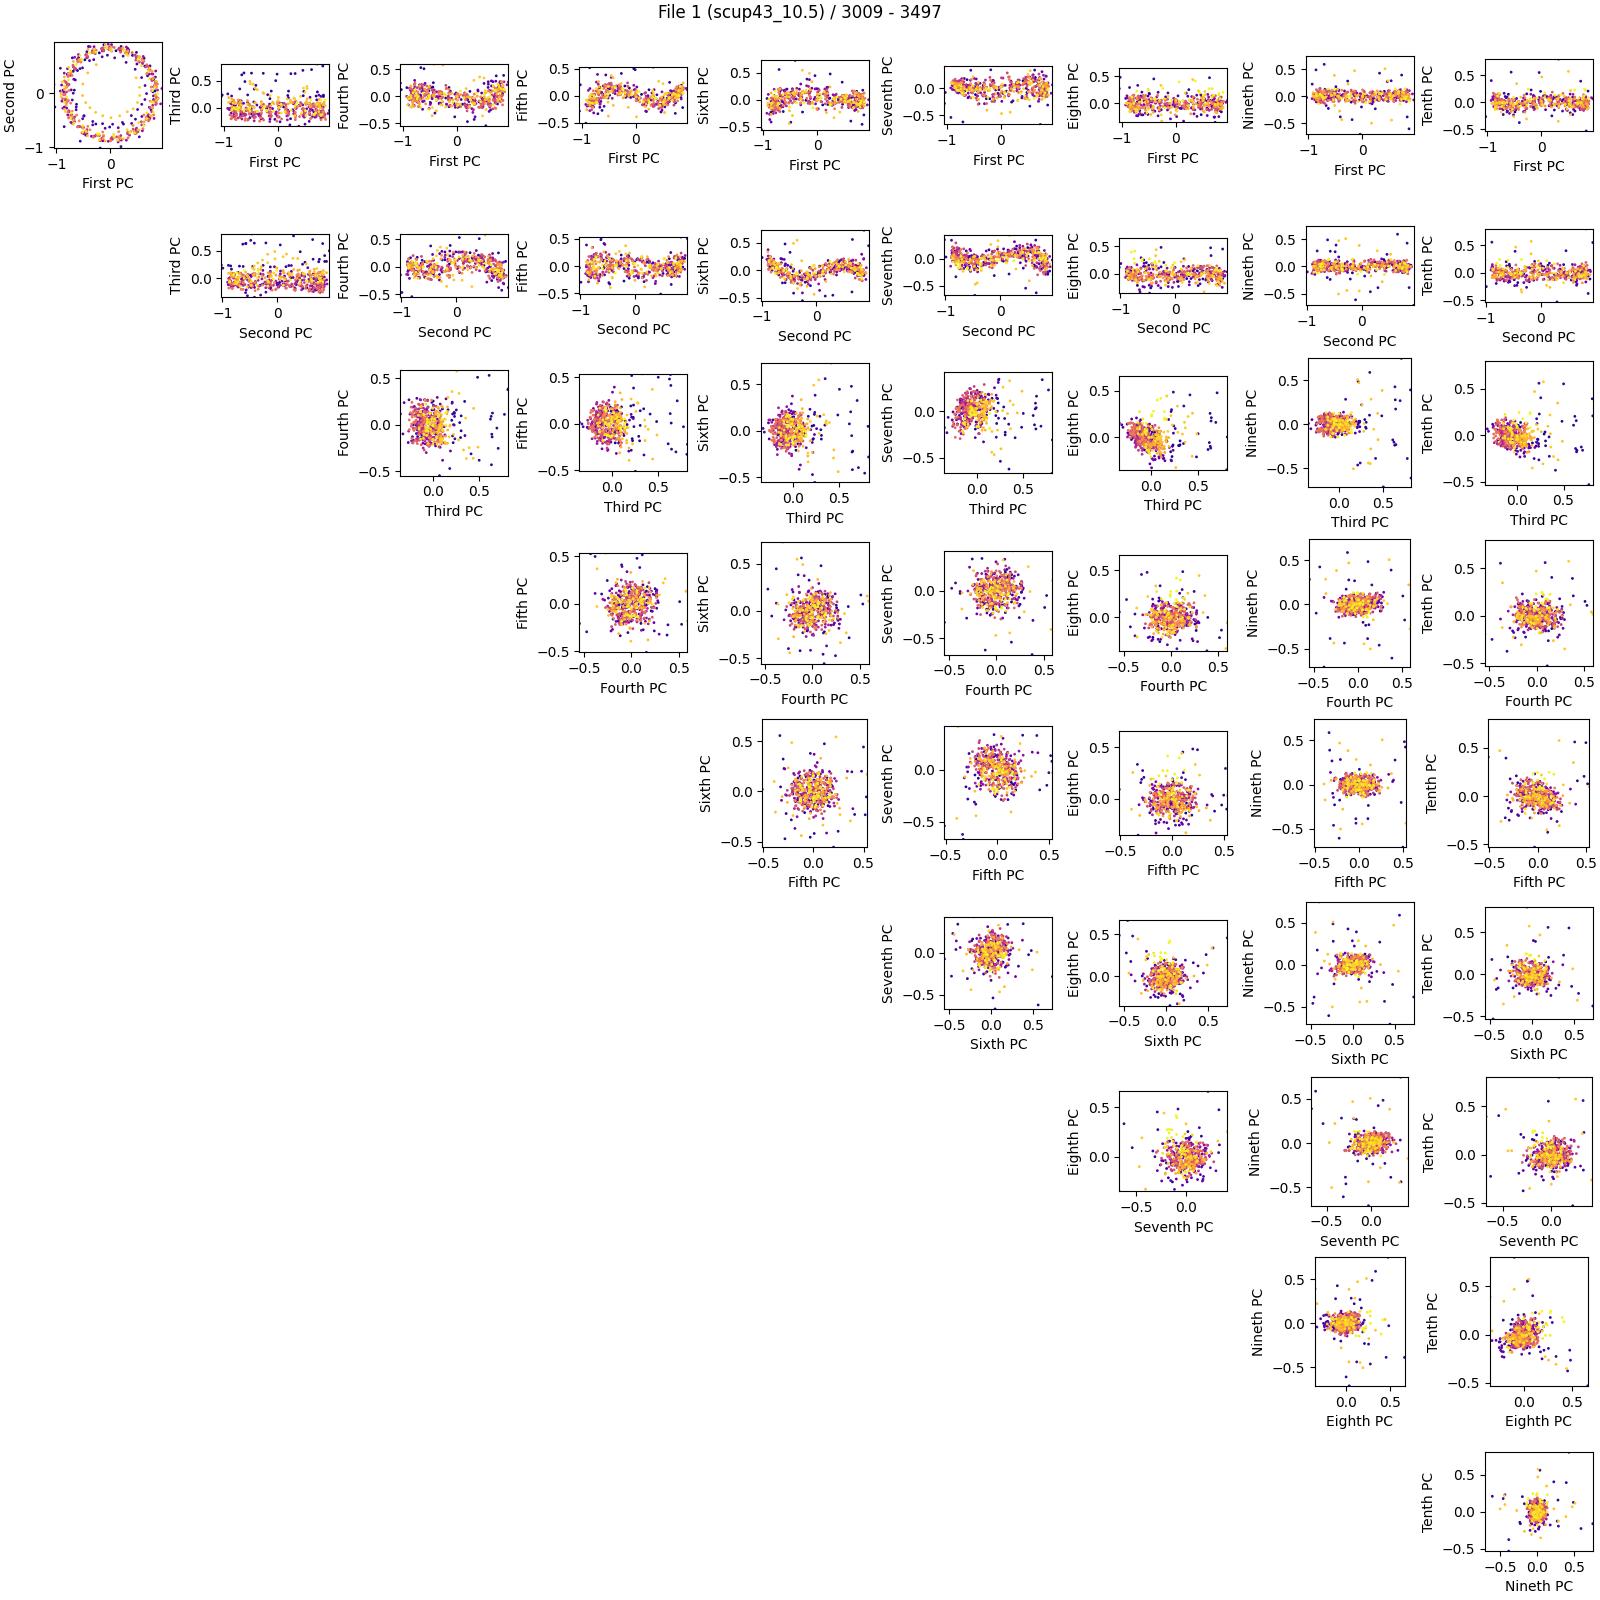
Due to the rarity of consecutive complete frames in the data, we looked only at one fish, namely scup43, where we had almost 500 consecutive complete frames at water speed 10.5Hz.
Inspired by [1], we then applied PCA using scikit-learn to reduce the dimensionality of the data and visualize it. Through empirical analysis, we found that the first two principal components captured most of the variance in the data and revealed interesting patterns in the fish’s swimming motion.
After that, we computed persistence diagrams using ripser to analyze the topological features of the data. In particular, we focused on the first Betti number (β1, or H1) to identify cyclic motion in the data, which corresponded to periodic motions in the fish’s swimming behavior.
(The “shadow” of the fish is the relevant frames, i.e., the frames in the current sliding window.)
Some of the challenges we faced included understanding the codebase and the mathematical concepts, i.e., topological data analysis and Betti numbers, behind the methods used. To overcome these challenges, we read relevant literature (e.g. this very accessible paper on PCA) and consulted with Dr. Jackson regularly.
Self-teaching numpy and matplotlib, I documented the codebase, improved the data pipeline, and wrote reusable data visualization functions the group referenced often later. I also identified a correlation between the speed of water flow and the frequency of fishtail flapping using cocycles.
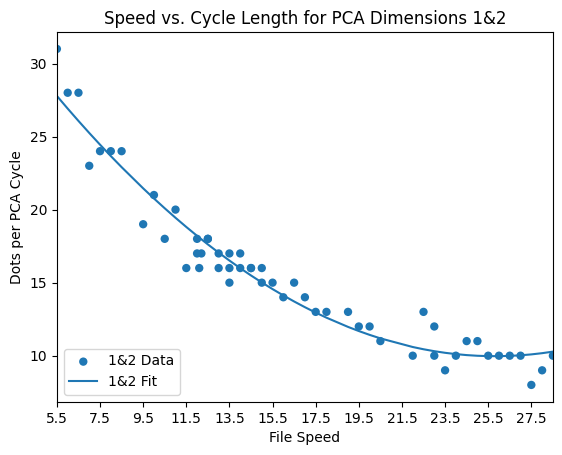
(We ran out of time to statistically verify this correlation, but it was an interesting observation nonetheless.)
The results of our research were presented as a poster at the Joint Mathematics Meetings (JMM) 2025 in Seattle, WA.
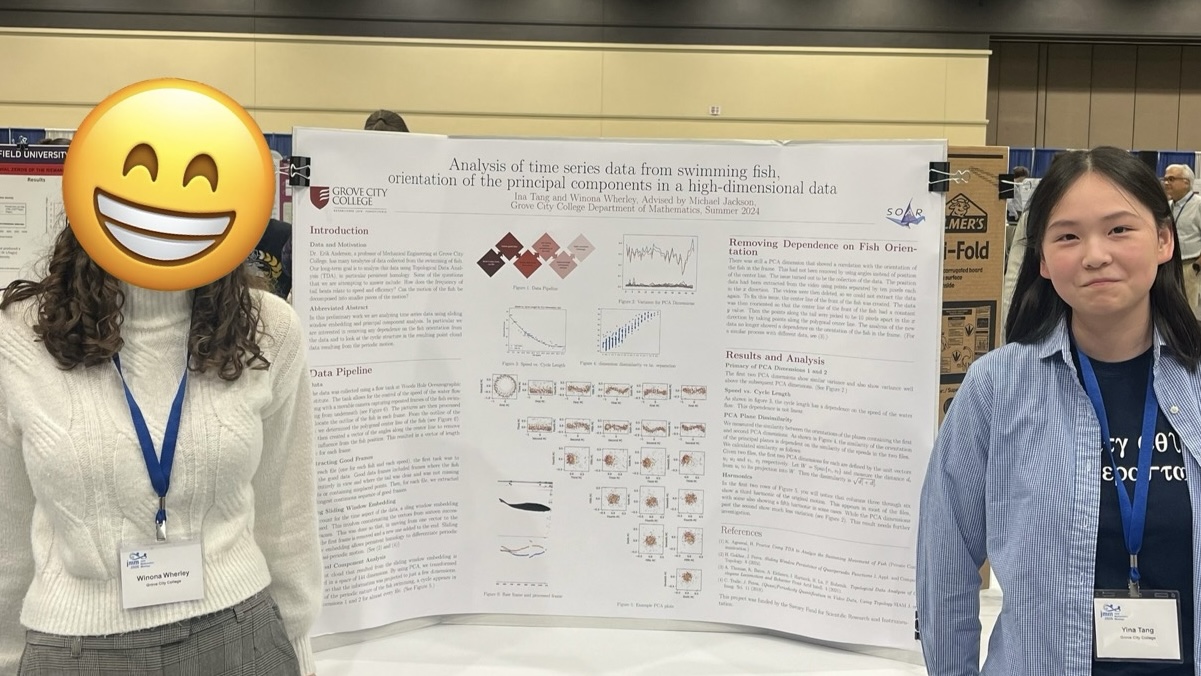
(That’s Winona on the left and me on the right XD)
In the future, we hope to look at more datasets from different fish, systematically compute the best length to consider from the tail, and incorporate vertical position data into our analysis.
This was my first research experience. Unsurprisingly, I learned a lot throughout this journey, from technical skills like data analysis and visualization to soft skills like collaboration and communication. Most importantly (or so I think), I learned that I enjoy research, especially the process of exploring new ideas, learning about them (reading papers!), and tackling problems.
I am grateful for the opportunity to work with Dr. Jackson and Winona, and I look forward to applying what I learned in future research endeavors.
P.S. JMM was my first academic conference, and it was so much fun! I never realized in context how many mathematicians there were, each working on different things, and it was especially nice to be surrounded by fellow mathematicians / universe explorers.
Footnotes
-
A. Thomas, K. Bates, A. Elchesen, I. Hartsock, H. Lu, and P. Bubenik, Topological data analysis of C. elegans locomotion and behavior, https://arxiv.org/abs/2102.09380 [math.AT], 2021. ↩
-
H. Gakhar and J. A. Perea, Sliding Window Persistence of Quasiperiodic Functions, https://arxiv.org/abs/2103.04540 [math.AT], 2021. ↩